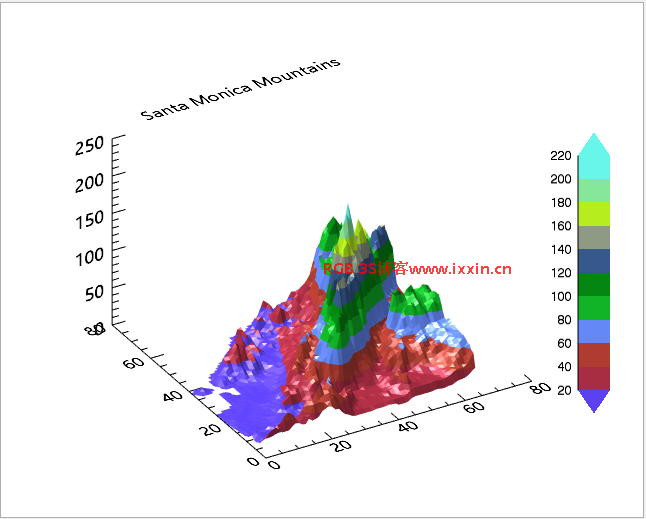
代码
Pro testcolorbar

  file = FILE_WHICH('elevbin.dat')
  dem = READ_BINARY(file, data_dims=[64,64])

  ; Display the data.
  c1 = CONTOUR(dem, $
    RGB_TABLE=30, $
    /FILL, $
    PLANAR=0, $
    TITLE='Santa Monica Mountains')

  ; Add the colorbar.
  cbar = COLORBAR(TARGET = c1, ORIENTATION=1, $
    POSITION=[0.90, 0.2, 0.95, 0.75])

  ; Move the Z Axis to the back.
  (c1['zaxis']).LOCATION = [0, (c1.YRANGE)[1], 0]

end
结果